Remote Sensing and Global Climate Change
Monitoring Our Water Resources
Remote Sensing & Monitoring Surface & Sub-Surface Water
Global Water Cycle
-
Human activity is now altering this global water cycle in many ways
-
Using more water for irrigation
-
Melting of glaciers through global warming
-
Surface Water- water exposed to atmosphere (rivers, lake, & ocean)
-
Monitored with electromagnetic radiation
Sub-Surface Water- water below surface, soil moisture & ground water
-
Difficult to capture with remote sensing
Remote Sensing:
-
Pollutants monitored indirectly- algal blooms, death of river vegetation, eutrophication
-
Eutophication measurements done by visible spectrum
-
NASA Pathfinder Program- NOAA/Nasa
-
Clear Water- reflects very little light
-
Turbid Water- higher reflectance
-
Algae & other aquatic vegetation- high reflection in green wave lengths
Mapping watersheds:
-
DEMS based on LIDAR data of SAR or ASTER data
-
Ground Water & Underground Watersheds
-
Gravity Recovery and Climate Experiment (GRACE)
-
2 satelites every 94 minutes make full rotation around Earth 30 days to cover whole planet
-
Measures changes in water resources on land
-
-
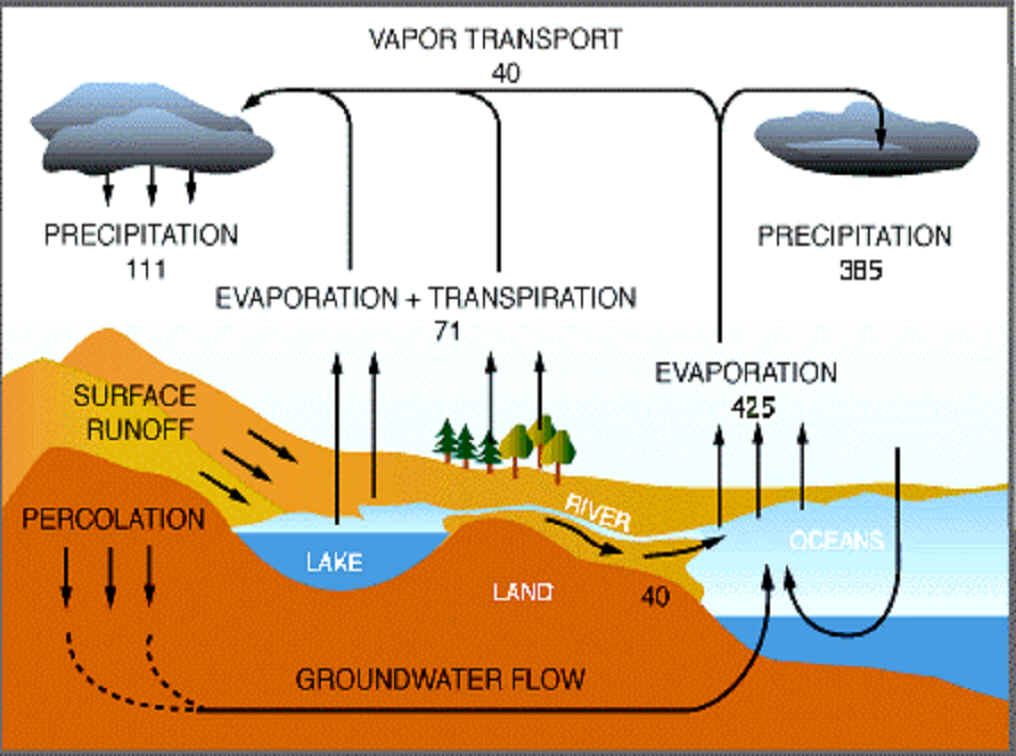
Global Water Cycle

Remote Sensing & Monitoring Oceans
Remote Sensing:
-
Pollutants monitored indirectly- algl blooms, or death of river vegetation, eutrophication
-
Eutophication measurements done by visible spectrum
-
NASA Pathfinder Program- NOAA/Nasa
-
Clear Water- reflects very little light
-
Turbid Water- higher reflectance
-
Algae & other aquatic vegetation- high reflection in green wave lengths
Sensors:
-
Active radar & passive optical
-
Seasat- first satellite designed for remote sensing of the Earth’s oceans with synthetic radar (SAR)
-
Only 43 hours of data
-
Laid groundwork for using microwave sensors for ocean monitoring
-
-
Coastal Zone Color Scanner (CZCS)- 1978- 1986
-
Marine Observation Satellite- Japan’s first Earth resources satellites
-
Medium Resolution Imaging Spectrometer (MERIS)
-
On European Space Agency Envisat platform
-
Observe color of oceans to estimate concentrations of chlorophyll & sediments
-
-
Sea-viewing Wide Field-of-View Sensor (SeaWiFS)
-
monitor ocean characteristics like chlorophyll concentration and water clarity
-
“Wetlands are highly productive and critical habitats for a great variety of plants and animals. Climate change is altering wetlands in many ways from rising sea-levels as well as changing precipitation and temperature patterns.”
“Varying plant densities, different species with similar spectral characteristics make remote sensing of wetlands challenging”
-
Sensors:
-
Higher spatial & spectral resolutions
-
Wetlands mapping is getting more accurate
-
Landsat & SPOT- medium resolution satellites
-
High resolution air-plane based
-
High resolution satellite imagery
-
Hyperspectral imaging shows promise in wetland studies with its high spectral resolution
-

Remote Sensing & Monitoring Wetlands
Remote Sensing & Sea Level Rise

SeaWiFS image Red Tide algal bloom March 1, 1999


Seasat image using radar Gulf of Mexico June, 26,1978
Monitoring our fresh water resources is imperative to our survival as a species.
Ocean pollution & algal blooms can lead to dead zones further depleting our oceanic resources.
World’s coastal areas are densely populated and growing rapidly
-
Current 2-3mm sea level rise per year
-
Main reason is global warming
-
4 reasons
-
As oceans warm water expands and increases in volume
-
Ice on land, glaciers & ice sheets melt- water in the ocean increases
-
Modeling of changing currents some parts of world will have higher sea levels
-
Erosion of coastal areas- relative rise in sea level
-
-
-
Costal hazard- made worse by storm surges, wave action, coastal erosion, wetland loss, and saltwater intrusion
-
Productive coastal wetlands and human dense areas low in elevations
Sensors:
-
NASA Pathfinder Program- NOAA/Nasa
-
Sea surface temperature (SST)
-
DEMs & LIDAR for elevation data, DEMs usually laid over IKONOS & Quickbird (higher resolution)
-
Gravity Recovery and Climate Experiment (GRACE)
-
Sea level change resulting from ocean temperature & water mass changes
-

A color infrared aerial photo of the USGS pilot wetland restoration site on Twitchell Island, in the Sacramento-San Joaquin River Delta.

Wetlands Encroachment Quickbird 2008